|
The US is the world’s single largest air transport market. Having been deregulated back in 1978 the domestic market has been able to grow and mature like many other industries.
New entrants have emerged (e.g. JetBlue), existing carriers have
merged and some carriers have failed. However, the overall market has
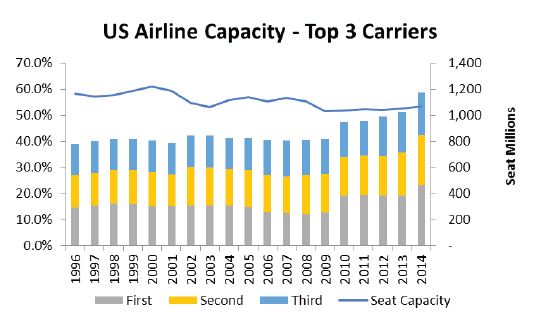
stagnated and even reduced in size. Total seat capacity, both domestic and
international, is 9% smaller today than it was in 1996.
Airline capacity data
from OAG Schedules Analyser shows that the US market has been through a
period of consolidation, as would be expected in other mature
industries. The three leading US carriers – based on seat capacity –
are American, Delta and United – (with Southwest a close fourth),
which together operate 59% of all US seat capacity, up from
37% nearly 20 years ago. When we consider domestic
capacity, this share becomes 62%. These three airlines are also
ranked as the top three in the world with a combined share of 13% of
global capacity. 
While Southwest
sits close to the top three players now (15.9% share of capacity compared to
United’s 16.0%), it has not always been so. When it started operations, the
world of full service carriers was viewed as separate to the market which LCCs
created and operated in. While the low-cost market has grown, Southwest has
maintained its place as the dominant player. The top three LCCs in the US –
Southwest, JetBlue and Spirit – now share over 80% of the LCC market. With
market maturity has come some convergence of the business models. LCCs now
provide over a quarter of capacity and when combined with the big three
alliances, they account for 93% of US domestic capacity. The merger of Delta
and Northwest (now operating as Delta) in 2008-2010, United and Continental
(now operating as United) in 2010-2012, and the merger of American and US
Airways (now operating as American) in the last two years have been the most
recent contributing factors to market consolidation. However, the market has
seen some consolidation both at this top end, as well as in the tail end. The
total number of airlines operating to, from and within the US has fallen from
252 back in 1996 to 173 today – although in reality the top 10 carriers account
for 87% of capacity. The sheer number of airlines in the tail end means that
the airline industry can perhaps be likened to a sector such as the beer market
with a few large players and a long list of much smaller craft and specialist
beers catering to specific tastes and localised markets. American, United and
Delta are the Budweiser, Coors and Miller of the US market. The US carriers
have been largely focused on their domestic markets in the last decade. After
years of weak financial performance, they are finally – through consolidation
and a favourable oil price – in a position where they appear to have come to
grips with how to keep a lid on supply and push yields up. For the past year
airline stocks have been rising. As a consequence, it is to be expected that
the focus should shift to growth and to international markets. A look at the
latest schedule for a week in April compared to the same week in 2010 makes it
clear that whilst US carriers have been growing international markets, foreign
carriers have been growing faster. International capacity share for US
carriers, of which the Big Three account for 83% seats has fallen from 57% to
53% allowing Gulf, Chinese and other carriers to increase their respective
shares.
Source: Source: OAG-The fight for Global Markets, 2015 issue |